6.1. Monitoring and Management
6.1.1. Managing Ngenea Hub with systemd
systemd is the tool that makes sure all the necessary programs and services on a Linux system start automatically, run properly, and restart if they crash.
The ngeneahub systemd service ensures that the application starts automatically on boot, stays running in the background, and can be easily managed using standard Linux commands like systemctl.
The service name is: ngeneahub
You can use the following commands to manage it:
sudo systemctl status ngeneahub     # Check if it's running
sudo systemctl start ngeneahub      # Start the service
sudo systemctl stop ngeneahub       # Stop the service
sudo systemctl restart ngeneahub    # Restart the service
6.1.2. Using the Command-Line Tool: ngeneahubctl
ngeneahubctl is a command-line tool designed to manually control the individual components of Ngenea Hub, such as starting, stopping, or checking the status of services like the web app or background jobs.
Unlike systemd, which manages the entire Ngenea Hub service as a whole, ngeneahubctl offers more fine-grained control and is especially useful for debugging or development purposes.
This tool is particularly helpful when systemd is not functioning correctly or if you want to test specific parts of the application without restarting the entire service.
In short ``ngeneahubctl`` is a component-level tool that complements systemd (but doesn’t replace it) by enabling quick debugging, testing, and troubleshooting of individual Ngenea Hub components.
6.1.3. Docker Containers
Docker containers are compact, isolated environments that package an application along with all its libraries and configurations, allowing it to run consistently across different systems without interference.
Ngenea Hub uses Docker containers to run its different components in isolated environments, which improves stability, scalability, and ease of management. Each container serves a specific function within the system:
Core Components
ngeneahub_backend: A middleware service built on Django. It provides the REST API, orchestrates jobs and workflows, and acts as the central logic layer connecting the database, UI, and background tasks.ngeneahub_db: A PostgreSQL database container. This third-party service stores all persistent data, including configurations, logs, and metadata for tasks and jobs.ngeneahub_redis: A Redis container acting as a fast in-memory key-value store. It serves multiple roles:Acts as a Celery results backend, storing temporary task results.
In some configurations, serves as the task queue (in place of RabbitMQ).
Facilitates direct communication of task/job states between the Hub and workers.
ngeneahub_rabbitmq(optional): A RabbitMQ container used as the task queue. Tasks are transmitted to workers via a pub-sub model. In some setups, Redis replaces RabbitMQ for this role.
Task Management & Scheduling
celery (internal worker): Despite the name, this container is an internal Celery worker responsible for asynchronous internal tasks like job refreshes and housekeeping. It does not represent the full Celery engine.celery-dags: Handles DAG-based workflow orchestration. This worker processes callbacks, submits child tasks, and handles the state and results of each step in a DAG.celery-events: Specialized for receiving streamed events from discovery services (e.g., SnapDiff). This replaces large event payloads that might exceed Celery’s size limits.celery-results: Receives streamed task results for tasks that produce large outputs, avoiding Celery payload size issues.celery-beats: A Celery scheduler. Triggers both internal and user-defined periodic tasks (e.g., data syncs, housekeeping routines).celery-monitor: Monitors the health and availability of Celery workers by listening for heartbeat signals and updating the central database accordingly.celery-exporter: Collects Celery performance metrics, such as queue lengths and worker status, and exposes them to Prometheus.task-daemon: A lightweight internal service responsible for updating task state at the moment a task is picked from the queue. Communicates via Redis.
Monitoring & Metrics
prometheus: A metrics storage and query engine, It gathers system and Celery metrics (via celery-exporter) and provides an API for data access (not publicly exposed).grafana: A visualization dashboard that displays system metrics collected by Prometheus. It is accessible via the/hubmetricsendpoint.
6.1.4. Hub Task Metrics
The Hub Task Metrics is a monitoring feature provided by Hub. This feature helps you monitor the status of tasks that are currently queued or being processed in the Hub, as well as the status of the workers that execute these tasks.
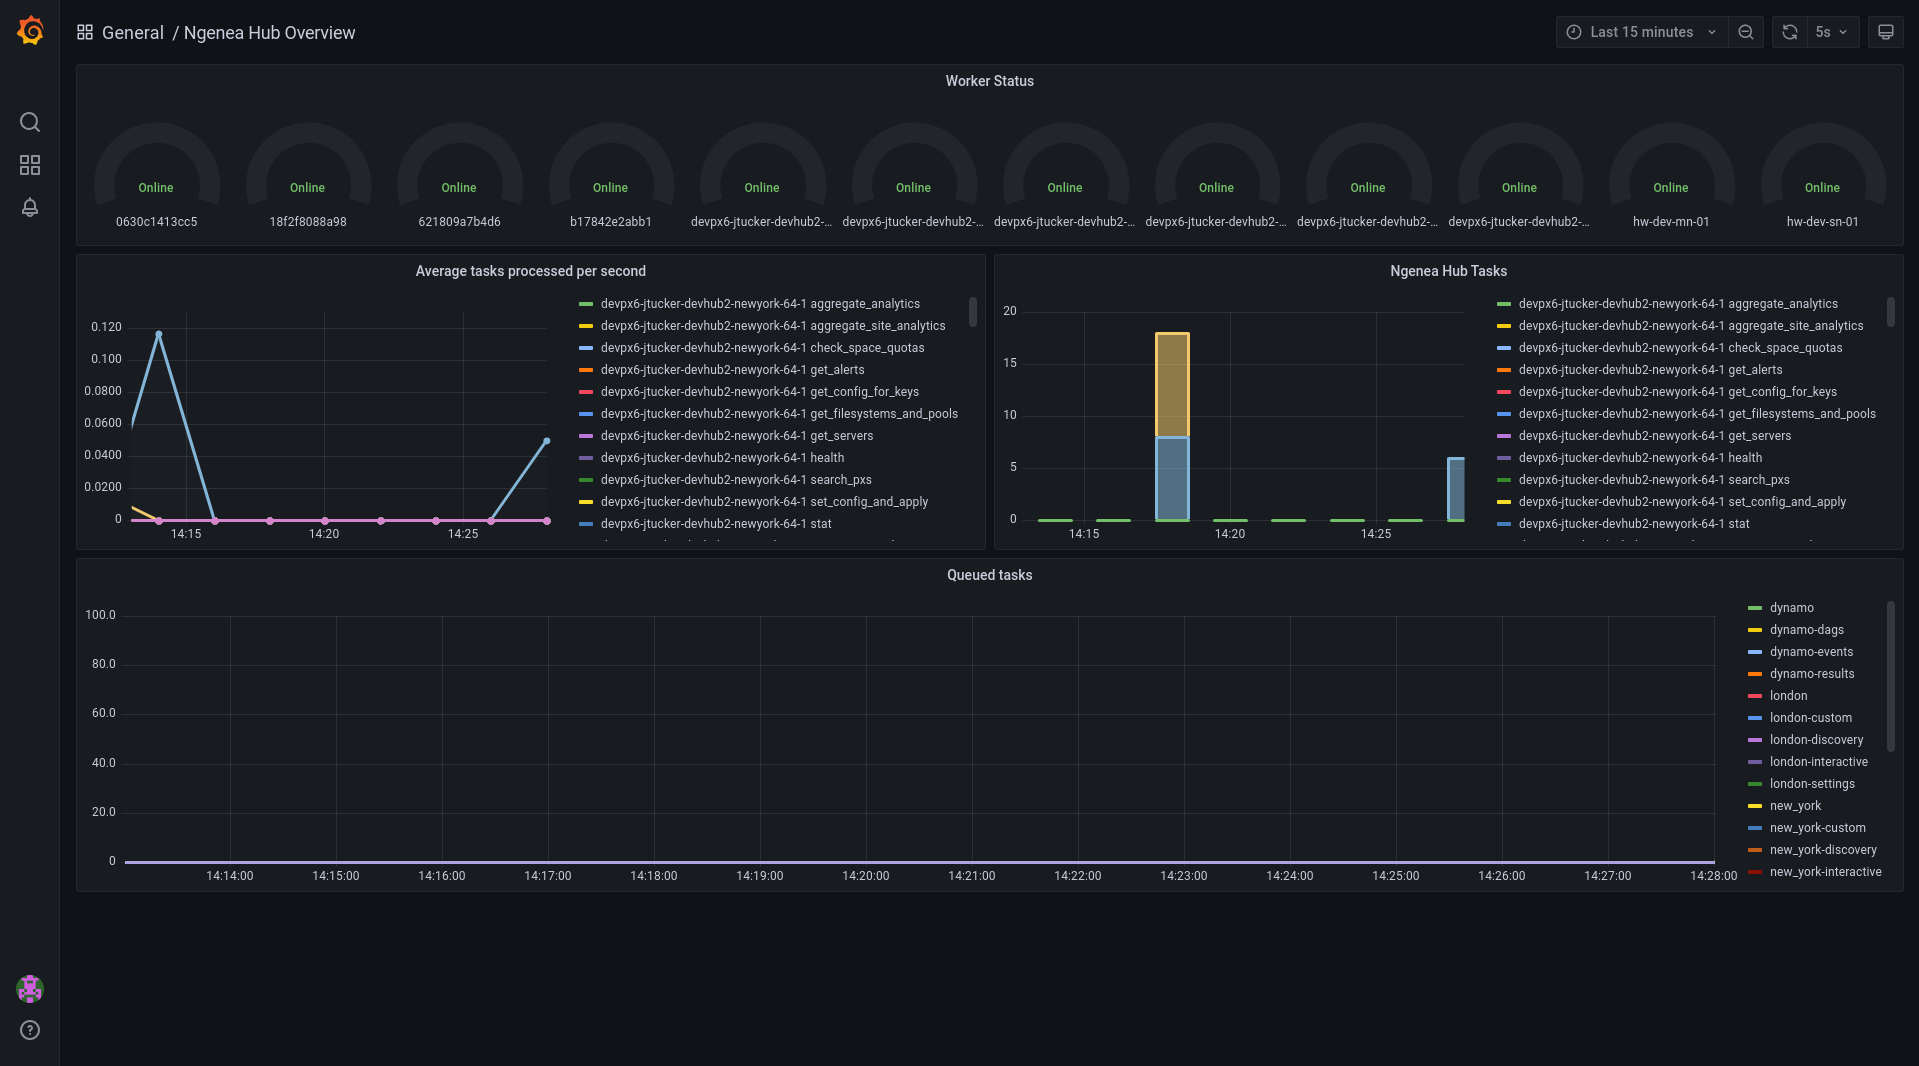
The Grafana Panel
Grafana is a popular open-source platform for visualizing time-series data like metrics and logs.
The Hub Task Metrics use Grafana panels to display data visually.
The panel shows the current queue of tasks waiting to be processed and the status (like idle, busy, or down) of each worker.
You can access the metrics at http(s)://myhub/hubmetrics, replacing myhub with your Hub’s actual hostname or IP address.
Authentication is required to access the metrics page to protect sensitive Hub data, so if you’re not logged in, you’ll be redirected to the login page or see an error.
6.1.5. Health Endpoints
Health endpoints are special URLs provided by a system to report the current status or health of various components it manages. They are used to monitor and check if everything is working properly.
To check the status of all the sites and the nodes (servers or machines) managed by Ngenea Hub, you can send a GET request to the special URL endpoint /api/health.
This request asks the Hub to provide information about:
All the sites it knows about.
The nodes within each site.
The status of the Hub service itself.
The Hub then tells you the health status based on how many nodes are currently online and working at each site using the following states:
ok: All nodes in the site are working fine.warning: Some nodes in the site are offline or not responding.critical: One or more entire sites are completely offline (no nodes are working).
So, by making this GET request, you get a quick overview of which parts of your infrastructure are healthy and which might have issues.
To make a GET request, use the following command:
curl -X 'GET' \
  'http://myhub/api/health/' \
  -H 'accept: application/json' \
  -H 'Authorization: Api-Key <api_key>'
Note
You can run the curl commands in a bash environment.
If you’re using Windows, it’s recommended to use a tool like Git Bash.
Make sure to replace <api_key> with your actual API key.
For more details on generating API keys, refer to the Programming Guide.
An example output of the health endpoint can be seen below:
{
    "overall_health": "ok",
    "hub_status": {
        "health": "ok"
    },
    "site_status": [
        {
            "site": "site1",
            "health": "ok",
            "nodes": [
                {
                    "name": "pixstor-east-ng-test",
                    "health": "ok",
                    "online": true
                }
            ]
        },
        {
            "site": "site2",
            "health": "ok",
            "nodes": [
                {
                    "name": "pixstor-west-ng-test",
                    "health": "ok",
                    "online": true
                }
            ]
        }
    ]
}
A request can also be performed to specific sites using /api/sites/ID/health/ to view the site specific health status:
{
    "site": "site1",
    "health": "ok",
    "nodes": [
        {
            "name": "pixstor-east-ng-test",
            "health": "ok",
            "online": true
        }
    ]
}