5.3. Monitoring and Management
5.3.1. systemd service
Ngenea Hub is controlled via the ngeneahub systemd service
5.3.2. ngeneahubctl cli tool
The ngeneahubctl tool can be used to manually stop/start the services, outside of
systemd, for debugging
5.3.3. Docker containers
Ngenea Hub uses a collection of docker containers, which can be managed by standard Docker monitoring/management tools and processes:
Container Name |
Description |
|
Web application |
|
Maintenance task controller |
|
Application database (Postgres) |
|
Task results backend and celery broker |
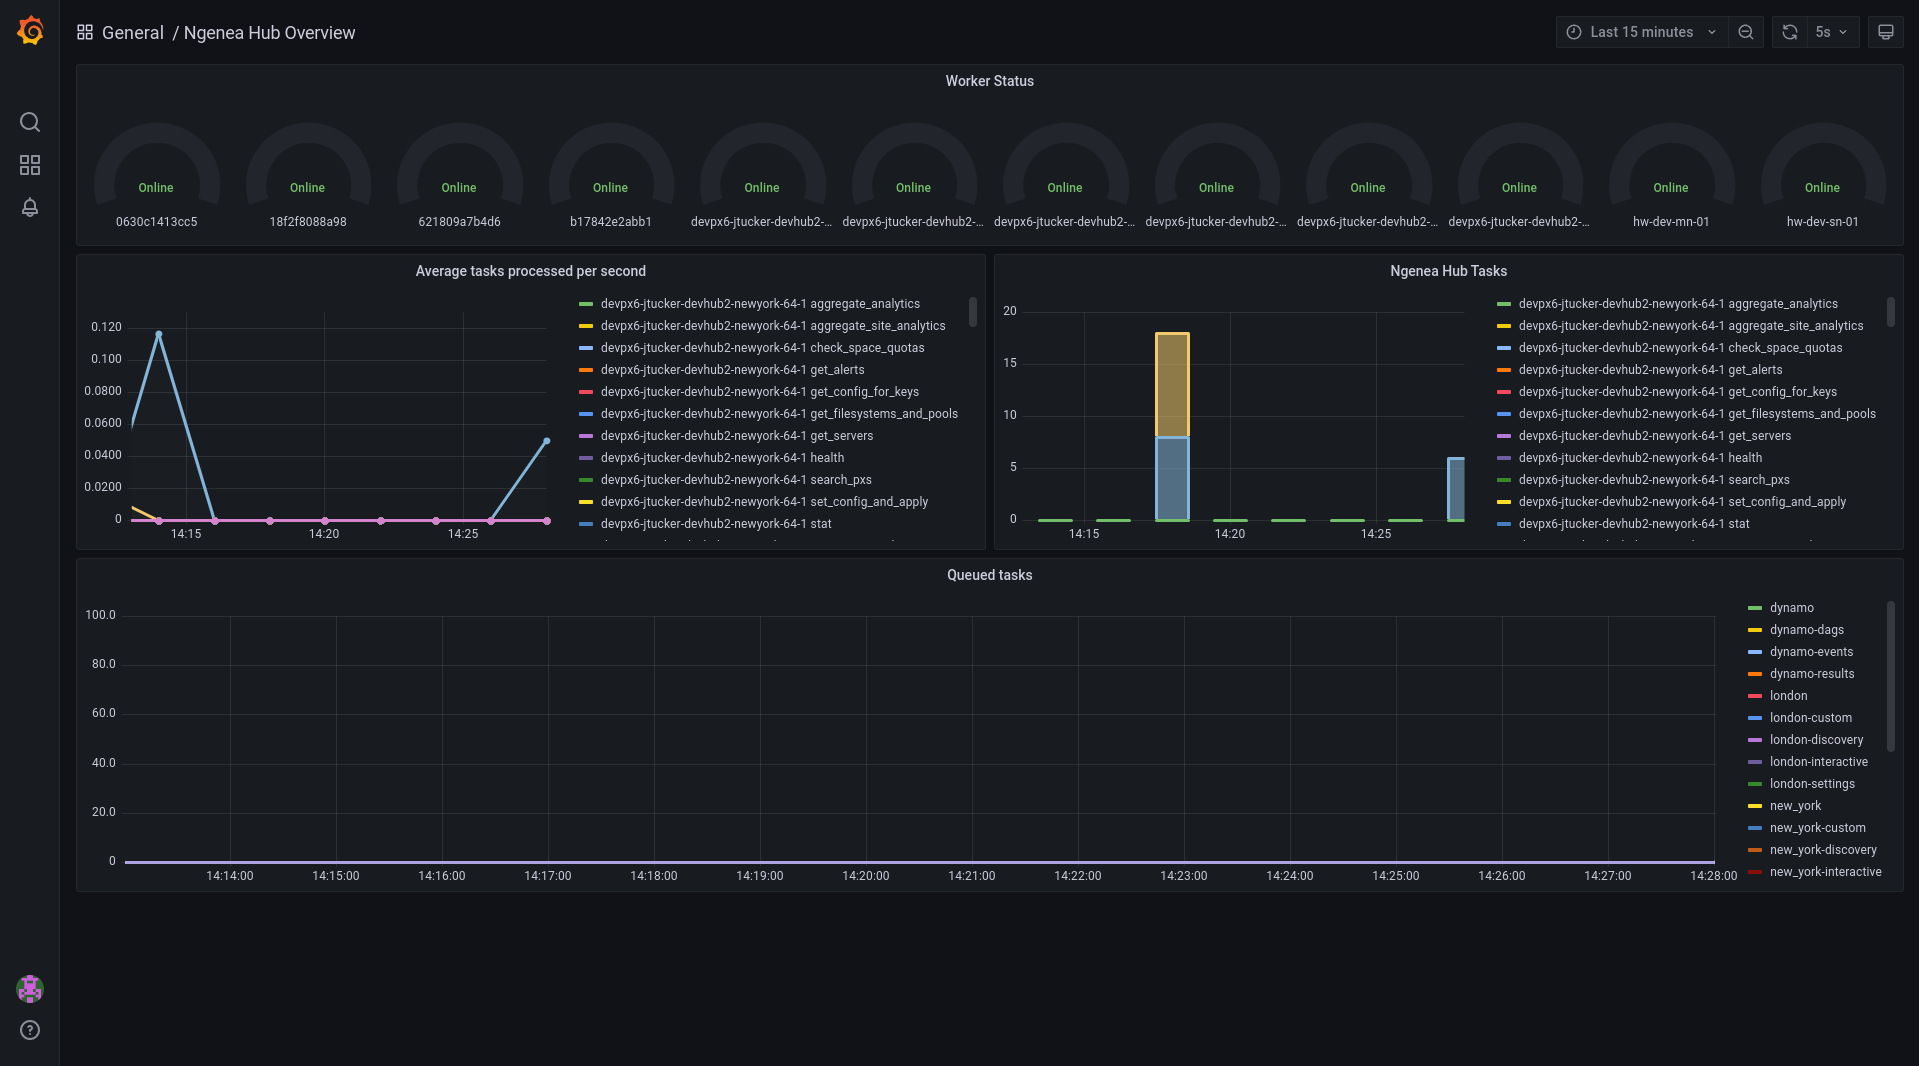
5.3.4. Hub Task Metrics
Hub provides a Grafana panel of the Tasks in the Hub queue and the status of the Workers.
To view the Metrics open the URL as follows, substituting the location of your hub. http(s)://myhub/hubmetrics
It is required to be authenticated to Hub in order to view the metrics.
5.3.5. Health endpoints
To view the state of all sites and related nodes within known to Ngenea Hub, a GET request can be performed to /api/health
to view all of the sites, nodes and the hub service itself. The states are currently based on how many nodes are online for
each site using the following states:
State |
Description |
|
All nodes are functional |
|
Some nodes are offline within a site |
|
One or more sites are completely offline |
An example output of the health endpoint can be seen below:
"overall_health": "ok", "hub_status": {
"health": "ok"
}, "site_status": [
- {
"site": "site1", "health": "ok", "nodes": [
- {
"name": "pixstor-east-ng-test", "health": "ok", "online": true
}
]
}, {
"site": "site2", "health": "ok", "nodes": [
- {
"name": "pixstor-west-ng-test", "health": "ok", "online": true
}
]
}
]
5.3.5.1. }
A request can also be performed to specific sites using /api/sites/ID/health/ to view the site specific health status:
"site": "site1", "health": "ok", "nodes": [
- {
"name": "pixstor-east-ng-test", "health": "ok", "online": true
}
]